This the fourth post in a series of posts commenting on the NAFTA renegotiation process. For Part I click here, for Part II click here, for Part III click here.
Reportedly, another thorny proposal being discussed in the renegotiation process is revamping or else doing away with the investor-State dispute settlement mechanism provided under Section B of Chapter Eleven of the NAFTA. Apparently, this mechanism is perceived as a key factor facilitating the migration of U.S. industry to Mexico because of the role it is believed to play in providing U.S. investors with certainty of legal protections there. In this Post I discuss basic data about foreign direct investment (“FDI”) in Mexico and whether eliminating such dispute settlement mechanism would be worth the trouble.
So, as usual, let’s start by looking at the numbers involved.
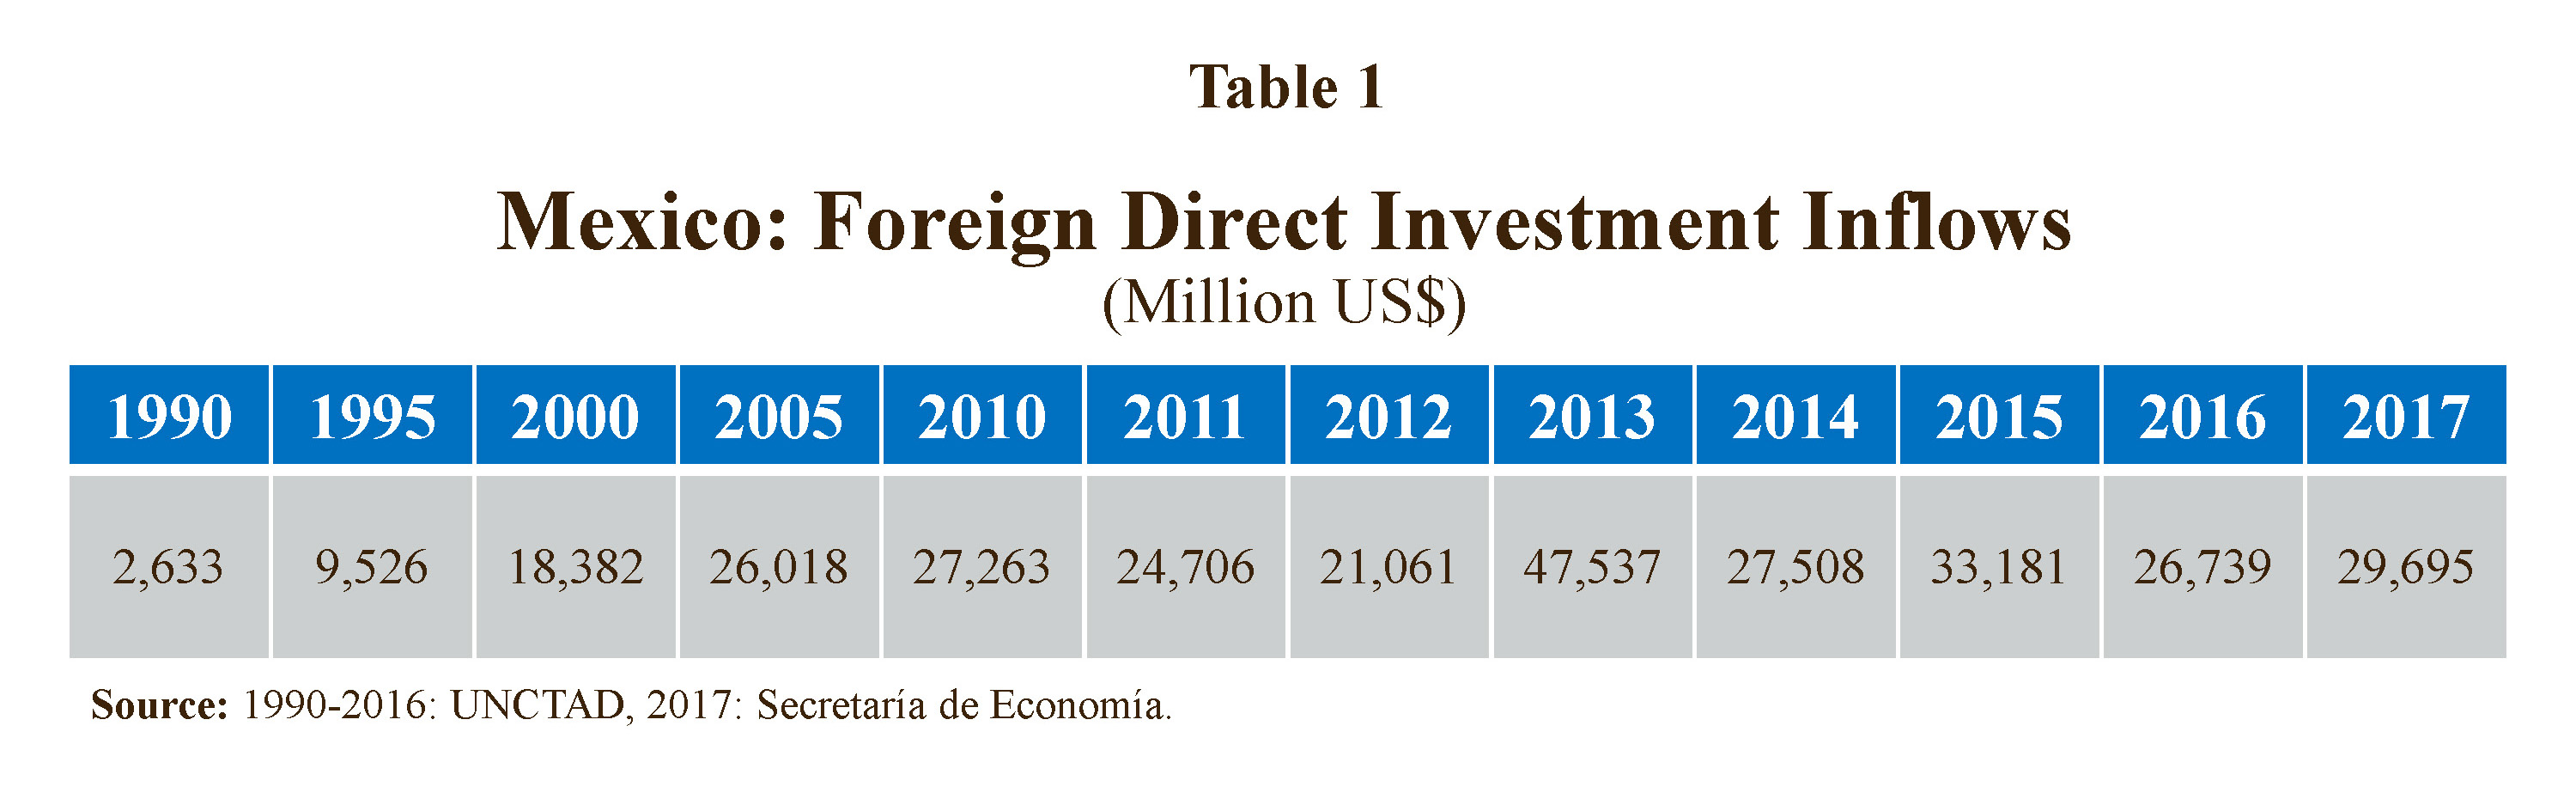
Table 1 shows annual FDI inflows to Mexico from 2010 through 2017 and provides prior data at five-year intervals for historical reference. In absolute terms, FDI inflows to Mexico are at a historical high. In particular, from 2010 through 2017 they averaged nearly US$ 30 billion per year. By contrast, in 2000-2009 they averaged close to US$ 24 billion per year and only US$ 8.5 billion per year in 1990-1999.[1]
That said, absolute figures on growing inflows of FDI are not all that telling because the economy also expands over time. Thus, one must ask whether the increase in FDI inflows has kept pace with the growth of the economy. Interestingly, since 1990 FDI inflows as a percentage of gross domestic product (“GDP”) have hovered around 2 to 3%. In particular, in 2010-2016 this ratio was 2.5%, as compared to 2.9% in 2000-2009 and 1.9% in 1990-1999.[2]
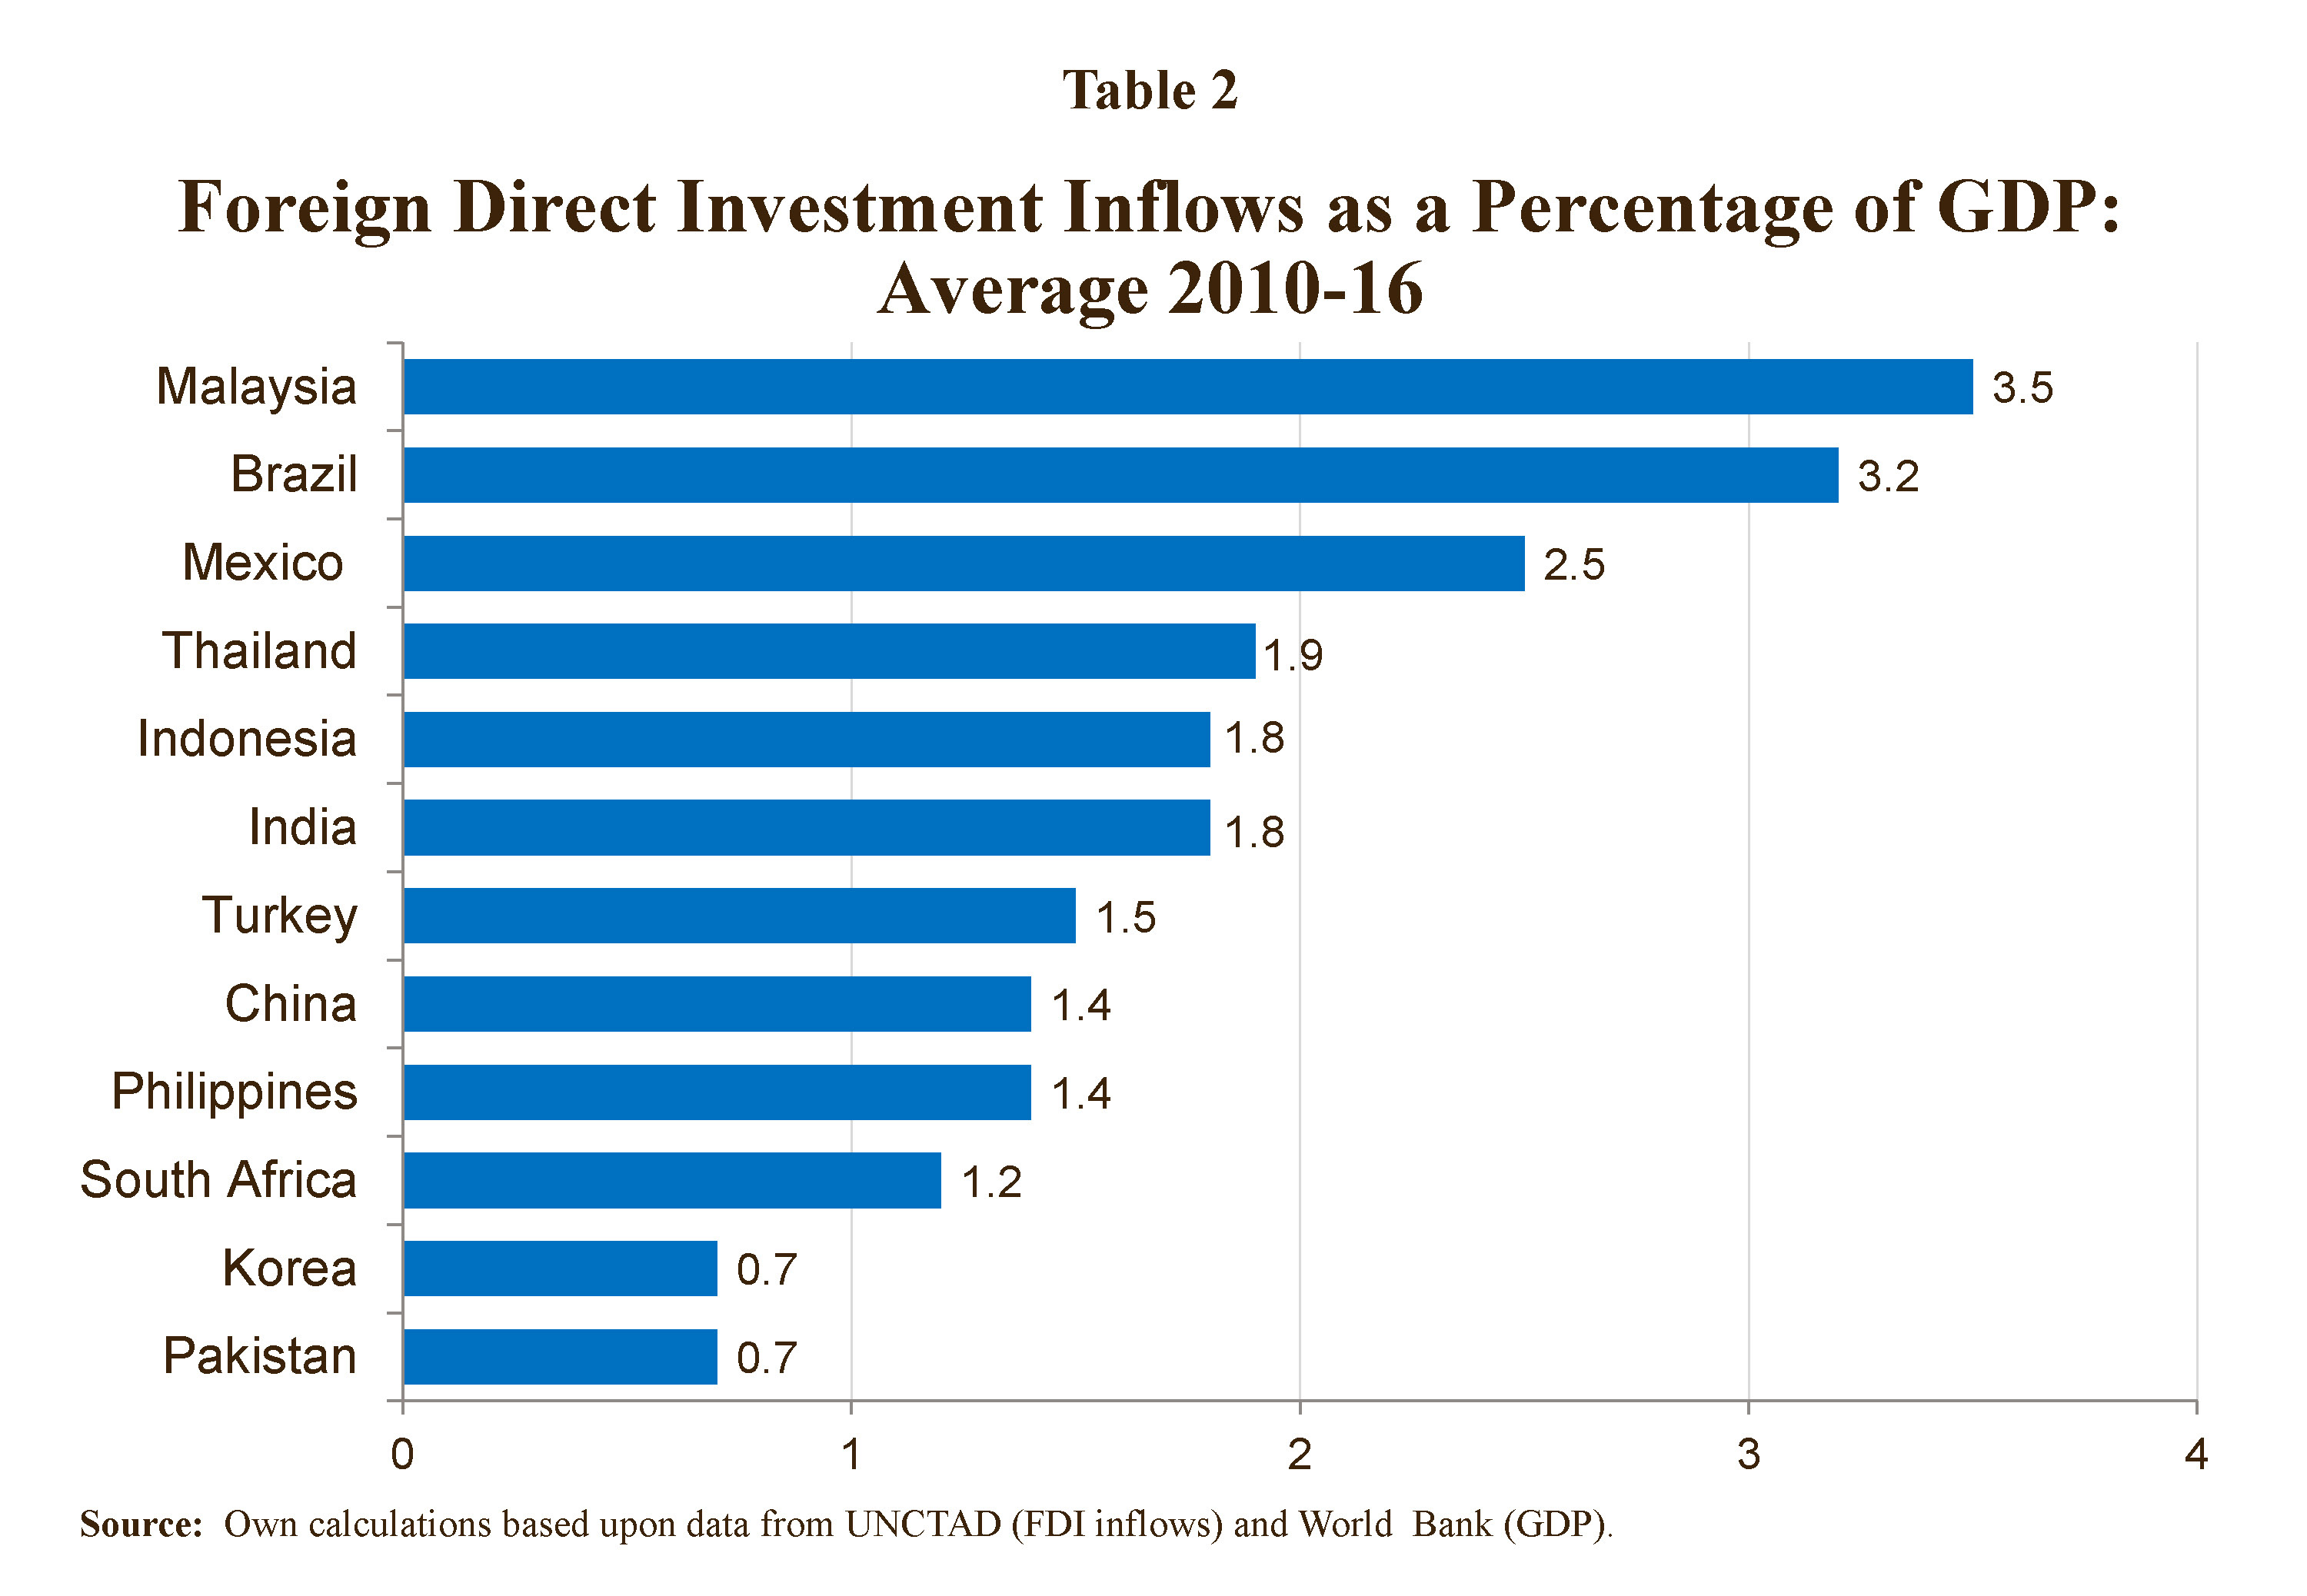
Observers such as Rodrigo Aguilera contend that, because Mexico’s ratio of FDI inflows to GDP is on the low end, Mexico is a huge disappointment in terms of attracting foreign investment.[3] To arrive at this conclusion he uses as benchmark Latin American countries such as Chile and Panama with sizable FDI inflows (into mining and financial services, respectively) but a small domestic market. However, if one uses as benchmark other developing countries with more diversified economies, Mexico stands out a preferred destination for foreign investors. In particular, as shown in Table 2, in terms of the ratio of FDI inflows to GDP Mexico was one of the top recipients of FDI from 2010 through 2016 and in this period it was outranked only by Malaysia and Brazil, coming ahead of Thailand, Indonesia, India, Turkey, China, the Philippines, South Africa, Korea and Pakistan.[4]
The Organization for European Cooperation and Development (“OECD”) has developed an index that quantifies the degree to which FDI is subject to restrictions in OECD members and 27 non-member countries (“OECD Regulatory Restrictiveness Index”). This index is calculated by sector and on the basis of this data an overall index is obtained. The values of the index go from 0 to 1, where 0 indicates complete absence of restrictions on FDI. Table 3 provides the values of the index for the countries in Table 2, where available. Surprisingly, countries with lower ratios of FDI inflows to GDP do not necessarily have higher values of the FDI restrictiveness index. For instance, South Africa ranks near the bottom in terms of the ratio FDI inflows to GDP and yet it has a relatively low value of the FDI restrictiveness index. This suggests that business opportunities, as opposed to the absence of restrictions, is the main driver of FDI inflows.

Importantly, the weight of the United States as a source of FDI inflows into Mexico has dropped sharply over time. In 2010-2016 the United States accounted for 40% of FDI inflows whereas 56% of FDI inflows were traceable to the United States in 2000-2009 and 53% in 1990-1999.[5]
Thus far, in Mexico, unlike other developing countries, the bulk of FDI inflows has gone into the manufacturing sector. Specifically, in 2000-2009 44% of the FDI inflows went into manufacturing and in 2010-2016 this share reached 54%.[6]
Although the bulk of FDI flows historically has gone into manufacturing, because of the reforms passed by the Mexican Congress in 2013-2014 huge amounts of FDI are expected to flow into the energy sector in the near future. In fact, the International Monetary Fund estimates that “FDI will increase by about $10 to $15 billion from current levels between 2016 and 2019 and by $20 to $ 30 billion between 2020 and 2025”.[7]
Bearing the above information in mind, there are two key questions on the investment front of the NAFTA renegotiation. One, whether the elimination of the dispute settlement panels under Chapter Eleven of the NAFTA would create massive uncertainty for investors and two, whether Mexico could not independently adopt a domestic mechanism that would serve as substitute for such panels. Although responding to the first question requires a crystal ball, it would appear that the elimination of the Chapter Eleven panels would not necessarily create massive uncertainty because there is no reason to believe investors in manufacturing, where the bulk of FDI has gone historically, would face a high exposure to a risk of expropriation or a regulatory risk in this sector. For instance, why would the Mexican Government ever want to expropriate or regulate wholly-owned automobile manufacturing, the hen that lays the golden eggs from Mexico’s perspective? Furthermore, since the reforms in the energy sector operate via contractual arrangements, it is conceivable that binational arbitral tribunals could be adopted as part of such contractual arrangements, thus providing certainty in respect of legal protections as currently available through the Chapter Eleven panels.
[1] Own calculations based upon data on FDI inflows from the United Nations Conference on Trade & Development (UNCTAD).
[2] Own calculations based upon data from UNCTAD (FDI inflows) and World Bank (GDP).
[3] See Mexico’s Foreign Investment Problem (available at https://www.huffingtonpost.com/rodrigo-aguilera/mexicos-foreign-investmen_b_7285512.html) and Mexico: The Case of the Missing FDI (available at https://www.huffingtonpost.com/rodrigo-aguilera/mexico-foreign-direct-investment_b_2671967.html).
[4] Incidentally, in 2010-2106 the ratio of FDI inflows to GDP was 1.5% for the United States. In that same period, Luxembourg’s ratio was nearly 60%. However, as in the case of Chile and Panama, this is the result of large FDI inflows coupled with a small domestic market.
[5] Own calculations based upon data from the WTO’s Trade Policy Reviews for Mexico and Secretaría de Economía.
[6] Own calculations based upon data from the Trade Policy Reviews for Mexico of the World Trade Organization (“WTO”) and Secretaría de Economía. By contrast, the share of financial services in FDI inflows heavily declined from 25% in 2000-2009 to 8% in 2010-2016 while the proportion of mining in FDI inflows went up from 3% in 2000-2009 to 8% in 2010-2016.
[7] International Monetary Fund, Mexico: Selected Issues, IMF Country Report No. 14/320 (November 2014), at page 13.
_______________________
*The opinions presented in this Post are mine alone and do not represent in any way official views of King & Spalding LLP or its clients.
_________________________
To make sure you do not miss out on regular updates of the Regulation for Globalization Blog, please subscribe to this Blog.
